In this guide
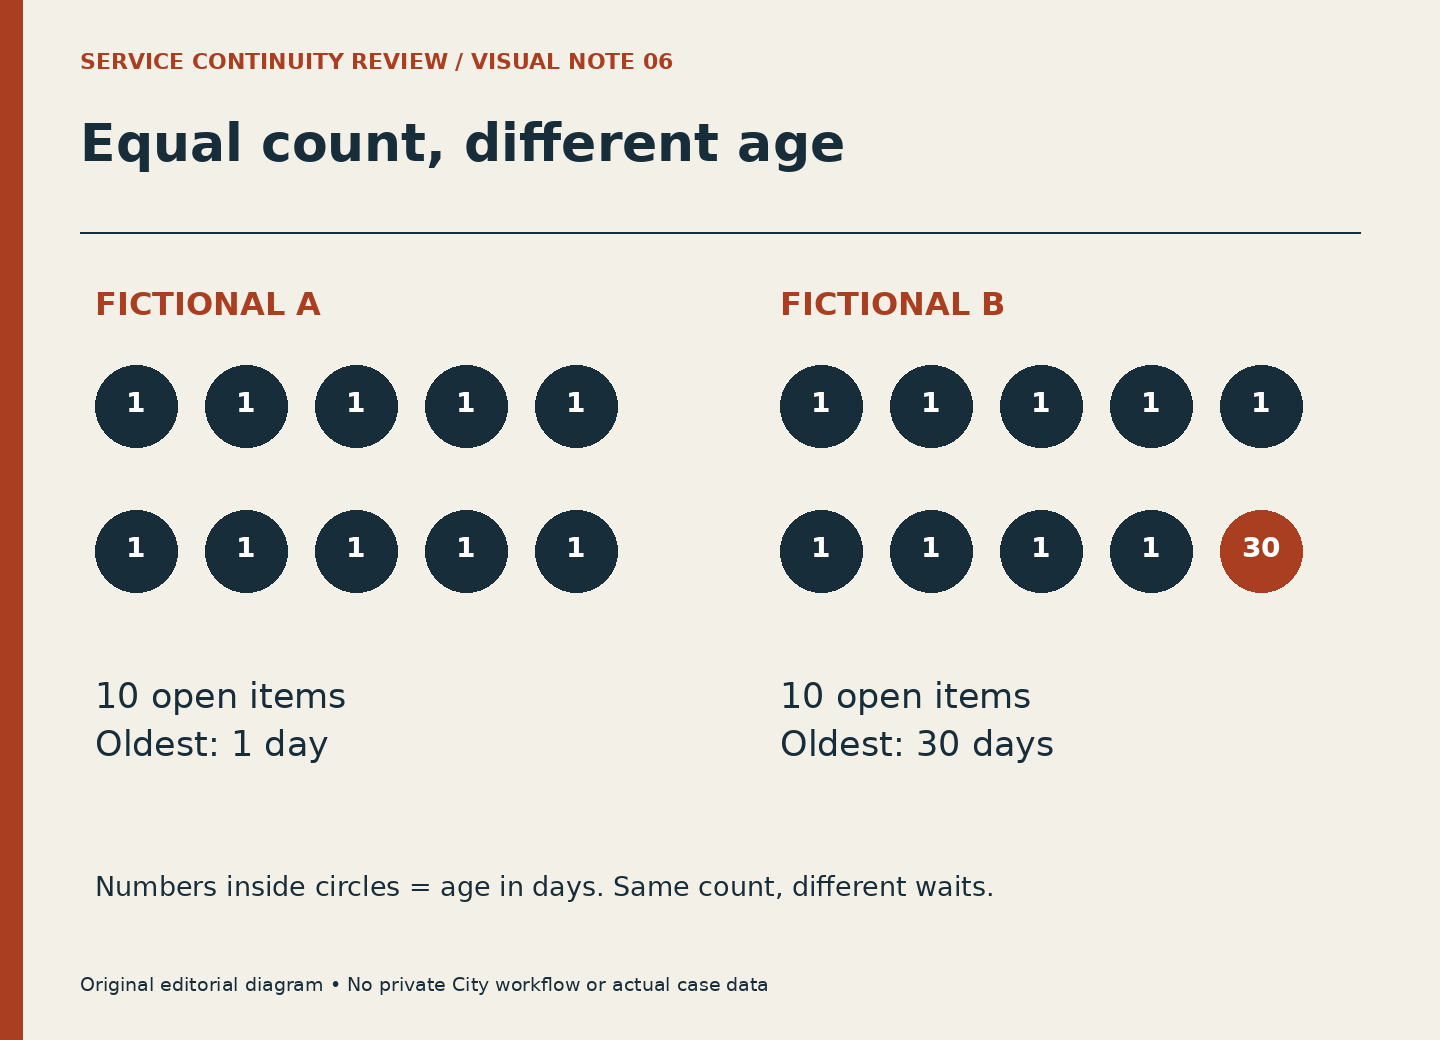
A queue of ten items can contain ten recent arrivals or nine recent arrivals and one much older unresolved item. The count is identical; the waiting experience is not. When reading public service data, queue size and age should not silently stand in for one another.
Phoenix’s performance-reporting resources provide a setting for asking careful measurement questions. The invented numbers in this article are not Phoenix data, and the article does not claim that any particular City dashboard publishes the age categories used here.
Define the population first
Open-work age asks how long unfinished items have been in a defined state. Completed-work duration asks how long finished items took. A completion-time average may omit every item still waiting. That can make a service look fast while leaving the oldest unresolved work invisible to that particular measure.
Neither measure is false merely because it excludes a different population. The mistake is using one to answer the other’s question. Write “open” or “completed” beside the number before describing the wait.
Compare two fictional queues
Queue A has ten items, all one day old. Queue B has nine items one day old and one item thirty days old. Both have ten items. Queue A’s oldest item is one day old; Queue B’s oldest is thirty. These numbers are an arithmetic illustration, not a service target or a report of actual cases.
Even this comparison leaves questions. Does age begin at first contact, acceptance of a complete request or entry into a particular stage? Are items waiting for outside information included? A different clock definition can change the meaning without changing the underlying work.
Do not turn age into a cause
An old item may involve a complex dependency, missing information, a disputed state or a capacity constraint. Age alone cannot identify the reason. The dependency guide helps separate those possibilities without deciding a real case from outside the responsible process.
A worker explaining a queue can use approved categories to distinguish ready work from work waiting on a prerequisite. An outside reader should not invent those categories or assume an item was neglected because it is old.
Ask for the distribution you actually need
If the question is whether a small group waits much longer, a median or average may be insufficient. If the question is total workload, the count still matters. If the question is recent throughput, completions during a defined period may be the relevant measure. There is no single number that answers every operational question.
A useful reading note states the population, start event and observation date, then explains the limitation. “Ten open items at the observation point” is a valid statement. “Everyone is receiving quick service” needs different evidence. Keeping that difference visible is a practical contribution to fair service analysis.
Read next
- Read a Phoenix Service Measure Before Reading Its Trend
- Find the Dependency Before Calling the Work Late
- One Request Is Not Always One Unit of Effort
Sources and limits
Public sources checked October 5, 2026. Editorial examples are hypothetical; official instructions and case-specific decisions remain with the responsible City service.
- City of Phoenix: City Manager’s Performance Dashboard
Public performance-reporting context. This article does not reproduce or audit live dashboard values.